
Most people blame their internet provider when a Zoom call freezes. But nine times out of ten, the real problem is sitting between your laptop and the access point — specifically, how your Wi-Fi signal is being measured and misunderstood.
There’s a common assumption that if your Wi-Fi bars look full, your connection is fine. That’s not how it works, especially for real-time video. Two numbers actually determine whether your call stays smooth or falls apart: RSSI and SNR. Understanding what they mean — and more importantly, what the thresholds actually are — can save you from a lot of unnecessary troubleshooting.
I’m Donna Parker, and I’ve spent years writing about and researching office network infrastructure, working through real setups in environments ranging from open-plan offices to multi-floor corporate buildings. The signal measurement topic comes up constantly, and the misinformation around it is genuinely widespread — even among IT teams.
What RSSI Actually Measures (And What It Doesn’t Tell You)
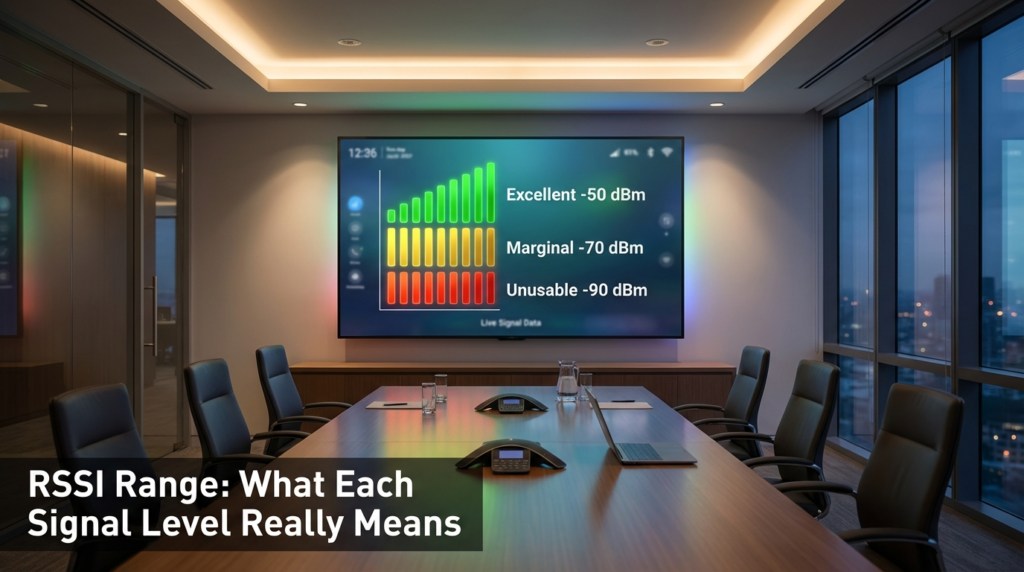
RSSI stands for Received Signal Strength Indicator. It’s a measurement of how strong the Wi-Fi signal is at your device’s antenna, expressed in decibels relative to a milliwatt — written as dBm. The scale runs into negative numbers, and here’s where people get confused: the closer to zero, the stronger the signal.
So -40 dBm is excellent. -80 dBm is weak. -90 dBm is essentially unusable.
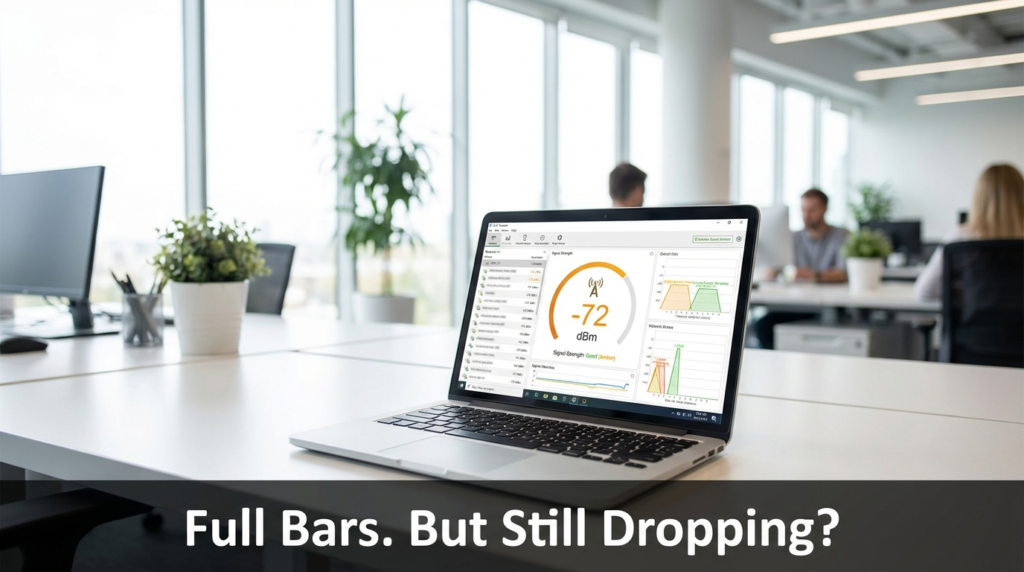
Most operating systems translate this into a “bars” display, but the bar system is vague by design — different devices set different thresholds for what earns a third or fourth bar. That means your laptop can show full Wi-Fi bars while sitting at -72 dBm, which is genuinely too weak for a stable Zoom session.
The -67 dBm Line You Need to Know
Here’s the specific detail that most guides skip over: for real-time video applications like Zoom, Microsoft Teams, or Google Meet, -67 dBm is the practical floor. Cisco’s Enterprise Mobility Design Guide specifically addresses this threshold, noting that voice and video traffic requires a minimum signal strength that standard data browsing does not.
Many IT guides — and even some vendor documentation — list -70 dBm as “acceptable.” And for loading a webpage or downloading a file, it is. But video conferencing is different. It’s continuous, bidirectional, and extremely sensitive to latency spikes and packet loss. At -70 dBm, you’re at the edge. At -72 or -75 dBm, you’ll start seeing pixelation, audio drops, and the dreaded “your connection is unstable” banner.
The difference between -67 and -70 dBm might sound trivial, but on a logarithmic scale, it represents a meaningful drop in signal power. In practice, it can be the difference between a clean 45-minute call and one that drops three times.
RSSI Signal Strength Reference Table
This table maps RSSI values to real-world performance for office Wi-Fi environments. It’s a useful reference when you’re looking at Wi-Fi diagnostic tools or your IT team’s access point reports.
| RSSI Value (dBm) | Signal Quality | Expected User Experience |
|---|---|---|
| -50 dBm or better | Excellent | Flawless video calls, fast file transfers, no perceptible lag |
| -51 to -60 dBm | Very Good | Stable video, minor buffering only in rare cases |
| -61 to -67 dBm | Good | Acceptable for video calls; Zoom, Teams work reliably here |
| -68 to -70 dBm | Marginal | Data browsing fine; video may show occasional instability |
| -71 to -80 dBm | Weak | Frequent call drops, choppy audio, unreliable streaming |
| -81 to -90 dBm | Very Weak | Basic browsing barely functional; video calls will fail |
| Below -90 dBm | Unusable | No reliable connection possible |
When I’ve walked through office spaces with a Wi-Fi analyzer tool, it’s not uncommon to find conference rooms sitting at -72 or -75 dBm — rooms that are actively used for daily video calls. The access point is in the hallway or the main open office, and the signal bleeds through a wall at a loss. Employees assume the Wi-Fi is “working” because they can browse. But video is a different story.
Why SNR Often Matters More Than Raw Signal Strength
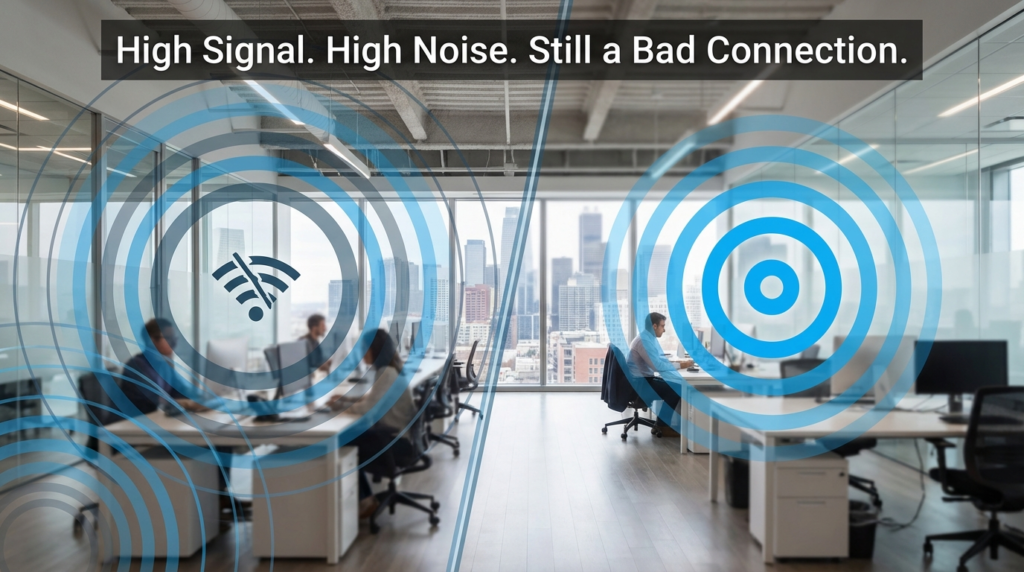
Here’s the piece that most coverage misses: SNR — Signal-to-Noise Ratio — is frequently more important than RSSI, especially in dense urban environments and shared office buildings.
SNR measures the difference between your Wi-Fi signal strength and the background noise floor. It’s expressed in decibels (dB), without the “m.” A higher SNR means your signal is standing out clearly above the noise. A lower SNR means the signal is getting buried.
You can have an RSSI of -60 dBm — technically “very good” — but if the noise floor in your building is sitting at -65 dBm (which is common in a crowded city block with dozens of overlapping networks), your SNR is only 5 dB. That’s terrible. Your device can hear the signal, but it can barely separate it from everything else competing for the same airspace.
What SNR Numbers Mean in Practice
For a reliable video call, you generally want SNR of 25 dB or higher. Anything between 15 and 25 dB will start showing instability under load. Below 15 dB, you’ll see consistent problems regardless of what your RSSI reading looks like.
| SNR Value | Video Call Reliability |
|---|---|
| 40 dB+ | Outstanding — clean signal with minimal interference |
| 25–39 dB | Good — video calls work reliably |
| 15–24 dB | Marginal — instability likely under load or in busy hours |
| Below 15 dB | Poor — packet loss and jitter expected |
In practice, the noise floor problem is worse in cities. A 20-floor office tower in a dense business district might have 50 or more Wi-Fi networks detectable from any given floor. Each one contributes to the noise floor, and older equipment broadcasting on crowded 2.4 GHz channels makes it worse. Moving to 5 GHz or 6 GHz helps significantly because those bands have less legacy interference, but the access points need to actually be placed close enough for the higher frequency signal to reach reliably.
Real Office Scenario: When RSSI Looked Fine But Calls Kept Failing
One scenario I’ve come across repeatedly in research and community discussions involves open-plan offices that were redesigned post-pandemic — the kind where conference rooms were added quickly without a full network reassessment.
The access points were placed for the original open-floor layout, not the new room divisions. RSSI readings from the IT dashboard showed -65 dBm across most of the floor — within acceptable range. But SNR in the new conference rooms was running between 12 and 18 dB because the rooms were surrounded by three other companies’ Wi-Fi networks broadcasting through shared walls.
The fix wasn’t adding more signal strength. It was adding a dedicated access point inside the conference room, switching to 5 GHz, and setting channel width to 40 MHz instead of 80 MHz to reduce the noise pickup. SNR jumped to 28–30 dB, and the call quality problems stopped.
This is exactly why treating RSSI as the only metric is a mistake. A clean, focused signal at -67 dBm with 30 dB SNR will always outperform a strong signal at -55 dBm with 10 dB SNR.
How to Check Your Own RSSI and SNR
On Windows, open Command Prompt and run netsh wlan show interfaces. It will show your current signal percentage, which you can convert roughly to dBm. For more detail, tools like Wi-Fi Analyzer (available in the Microsoft Store) show both signal and noise in real time.
On macOS, hold the Option key and click the Wi-Fi icon in the menu bar. It will display RSSI and noise floor directly, and you can calculate SNR yourself by subtracting the noise value from the RSSI value (ignoring the negative signs).
On Android, apps like Wi-Fi Analyzer by farproc show RSSI and channel congestion clearly. On iOS, Apple restricts direct access to these metrics in third-party apps.
For IT teams managing an office, enterprise access point dashboards from vendors like Cisco, Ubiquiti, or Aruba typically surface both RSSI and SNR per connected client. Checking these during a reported call quality issue is far more useful than pinging the internet.
Specific Downsides: What Can Silently Hurt Your SNR
A few factors that genuinely damage SNR without being obvious:
- Microwaves and older cordless phones operating on 2.4 GHz raise the local noise floor directly. If your breakroom shares a wall with a conference room, this matters.
- Channel overlap between neighboring networks is the most common urban problem. If you and three neighbors are all on channel 6 in the 2.4 GHz band, you’re all interfering with each other.
- Cheap access points with weak filtering pick up more background noise than enterprise-grade hardware, even at the same RSSI.
- Physical obstructions that cause multipath interference — signals reflecting off metal furniture, glass walls, or HVAC ducts — can lower effective SNR without lowering signal strength on paper.
The Cisco Enterprise Mobility Design Guide (cisco.com/c/en/us/td/docs/solutions/Enterprise/Mobility/emob30dg/emob30dg.html) covers recommended signal thresholds for voice and video in enterprise environments, and it’s worth reading if you manage a medium or large office network.
FAQs
Q: My Wi-Fi shows full bars but Zoom keeps freezing. Why? Full bars reflect RSSI above a basic threshold, but your SNR might still be poor. High interference from neighboring networks causes packet loss even with strong signal. Check SNR — if it’s below 20 dB, that’s your problem.
Q: Is -70 dBm good enough for video calls? For basic browsing, yes. For real-time video like Zoom or Teams, -70 dBm is borderline and often causes instability under load. Cisco’s guidelines recommend -67 dBm as the minimum for voice and video traffic.
Q: What’s a good SNR for a conference room? Aim for 25 dB or higher. Below 20 dB and you’ll likely see problems during peak office hours when surrounding networks are busiest.
Q: Should I use 2.4 GHz or 5 GHz for video calls? 5 GHz whenever possible. It has more available channels, less legacy interference, and supports higher throughput. The tradeoff is shorter range, but in an office setting where you’re close to the access point, that’s rarely an issue.
Wrapping Up
RSSI and SNR aren’t just IT metrics — they’re the actual reason your Zoom call sounds like a robot or drops right before the most important part of a presentation. The -67 dBm threshold is real and specific, and the bar display on your device hides it completely. In crowded offices and dense city buildings, SNR is often the bigger culprit — your signal might be strong, but if it’s drowning in noise, performance suffers.
The next time someone reports persistent call quality issues, don’t just check if the internet is “working.” Pull up the actual RSSI and SNR values from the client or the access point dashboard. That data tells a clearer story than any speed test.


